- Home
- About
- Voter Guide
- Green Party Voter Guide - November 4, 2024 elections
- Green Party Voter Guide - March 5, 2024 elections
- Green Party Voter Guide - June 7, 2022 elections
- Green Party opposes recall and endorses Dan Kapelovitz for Governor.
- Green Party Voter Guide - Nov 3, 2020 elections
- Green Party Voter Guide - March 3, 2020 elections
- Green Party endorses Measure R: Los Angeles County Sheriff Civilian Oversight Commission Ordinance
- Green Party supports Loraine Lundquist for Los Angeles City Council, District 12, March 3 election
- Green Party supports Sarah Kate Levy & Nithya Raman for Los Angeles City Council, District 4, March 3 elections
- Green Party Voter Guide - Spring 2019 elections
- Green Party Voter Guide - Fall 2018 elections
- Green Party Voter Guide - Spring 2018 elections
- Green Party Voter Guide - Spring 2017 elections
- Green Party Voter Guide - Fall 2016 elections
- Nov 2016 Santa Monica Ballot Measure Recommendations
- Issues
- LA County Board of Supervisors expansion and ranked-choice voting
- Los Angeles elections by ranked choice voting
- Larger Los Angeles City Council
- GPLAC Statement on DACA - Nov 2017
- GPLAC Declaración sobre DACA - Nov 2017
- GPLAC Calls for President to Release Tax Returns, Congress to Explore President’s Conflicts of Interest
- GPLAC Endorses Presidential Recount 2016
- LA Charter Reform: Elect a substantially larger LA City Council by Proportional Ranked Choice Voting
- Electoral reform public hearings
- Endorse AB 446 w/amendments
- GPLAC concerns with scope of Ad Hoc Committee on City Governance Reform
- Green Party calls for resignation of City Councilmember John Lee
- Green Party position on CA Recall Election Reform
- Green Party welcomes resignation of LA City Councilmember Martinez, calls upon councilmbmers Cedillo and De Leon to Resign
- Oppose SB 625
- Repeal Top Two Elections
- Elections
- Green Party candidate endorsement questionnaire
- Run Green for State and Federal Office in June 2026 primary election
- Elections - Archive
- Run Green for State and Federal Office in March 2024 primary election
- Run for office in LA County as a Green 2023-2024
- 2022 Candidate Questionnaire - Los Angeles Mayor and City Council
- Run Green for State and Federal Office in June 2022 primary election
- ZOOM: Meet Dan Kapelovitz, Green governor candidate in Sept 14 California Recall election
- Run for Los Angeles Neighborhood Council in Spring 2021
- Run Green for State and Federal Office in March 2020
- Run for office in LA County as a Green 2020-2021
- California Greens holding elected office (November 2020)
- 2020 Candidate Questionnaire - LA CD4
- Neighborhood Council Elections 2019
- Workshop: Run for LA Neighborhood Council in 2019
- Run for office in LA County as a Green 2017-2018
- County Council
- County Councilmembers
- Officers
- Agendas and Minutes
- Agendas and Minutes 2026
- Agendas and Minutes 2025
- Agendas and Minutes 2024
- Agendas and Minutes 2023
- Agendas and Minutes 2022
- Agendas and minutes 2021
- Agendas and minutes 2020
- Agendas and minutes 2019
- Agendas and minutes 2018
- Agendas and minutes 2017
- Agendas and minutes 2016
- Agendas and minutes 2012
- County Council meeting agendas and minutes 2015
- Agendas and minutes 2008
- Agendas and minutes 2007
- Agendas and minutes 2006
- Agendas and minutes 2005
- Agendas and minutes 2004
- Agendas and minutes 2003
- Agendas and minutes 2002
- Agendas & minutes 2001
- Bylaws (current version)
- Rules & Procedures (current version)
- Bylaws, Rules and Procedures (archives)
- How to Run for GPLAC County Council in 2024
- County Council election results
- GPLAC eRules
- How to Run for GPLAC County Council in 2020
- Donate
- Volunteer
You are here
Proposal: Green Party of California Ballot Status - Via Voter Registrations
Proposal: Retaining Green Party of California Ballot Status Via Voter Registrations
Sponsor: Green Party of Los Angeles County
Presenters: Timeka Drew, Mike Feinstein
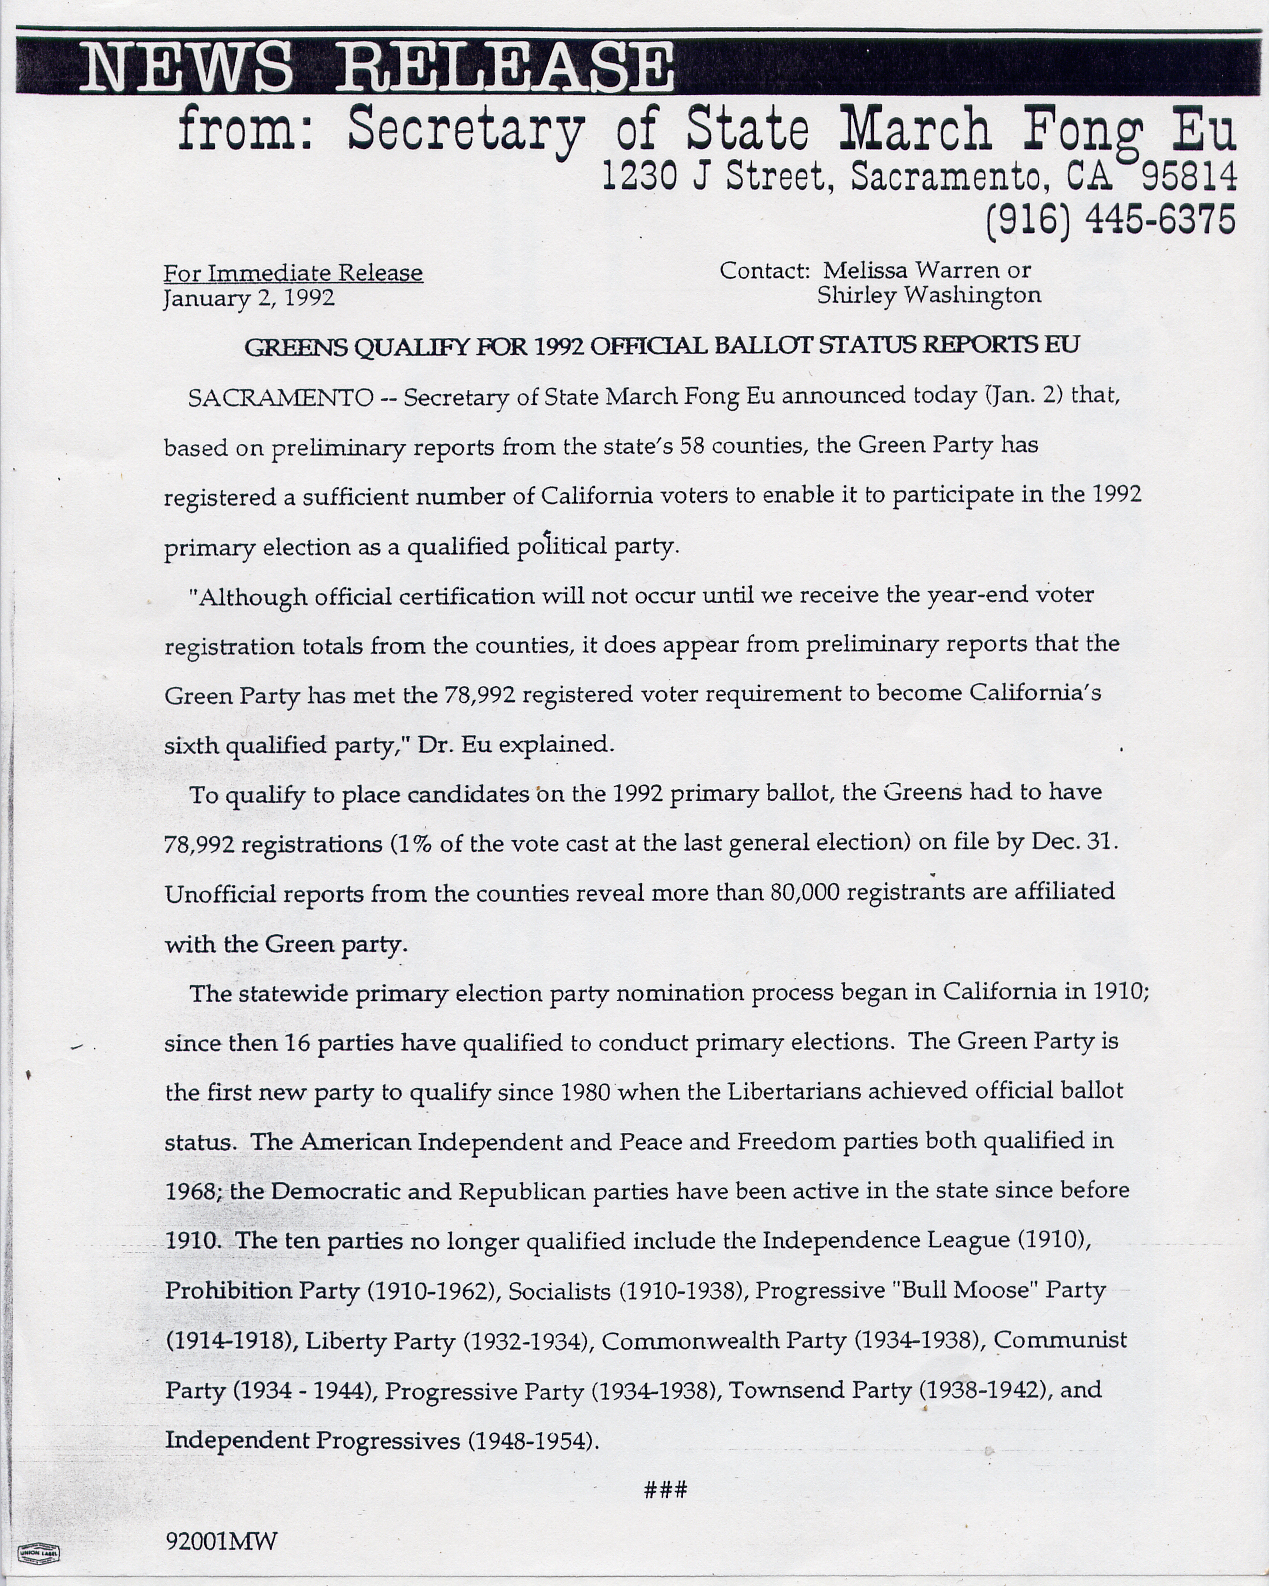
Background: The Green Party of California (GPCA) initially qualified for the ballot on December 31, 1991 - and was officially certified as a qualified political party by the Secretary of State, based upon 100,897 Green registrations gathered by December 31, 1991, more than the 78,992 needed to qualify the party at that time (https://www.cagreens.org/history/founding).
Today the GPCA faces its greatest challenge since then in retaining ballot status, with ballot status only guaranteed through 2022, and with most long-term GPCA trends heading downward (more on this during the General Assembly presentation of this proposal and in the attachments below).
There are two ways the GPCA can retain its ballot status in 2022. One is to maintain a Green voter registation total above a certain threshold. The other is for a Green candidate for a statewide office to receive at least 2% in the June 2022 primary - either Governor, Lt. Governor, Attorney General, Secretary of State, Treasurer, Controller, Insurance Commissioner or U.S. Senate. This could be either a single Green running for any of those offices, or more than one Green running for the same office, combining their totals.
This proposal puts forward a 2022 strategy to retain GPCA ballot status via voter registrations. A statewide candidate strategy to retain ballot status will be addressed in a separate proposal (https://losangeles.cagreens.org/gpca/retaining-ballot-status-via-statewi...). Below are links to background information for this proposal. At the GPCA General Assembly, a power point presentation will be made using some of this material.
To retain ballot status via the voter registration option, Green registration needs to remain equal in number to at least 0.33 percent of the total number of voters registered on the 154th day before the primary election or the 123rd day before the presidential general election. (Elections Code §§ 5100(b), 5151(c). https://www.sos.ca.gov/elections/political-parties/political-party-quali...
Right now that 0.33% is 68,180. The GPCA's registration total as of September 4, 2020 is down to 81,304 (0.38%)
Since Bernie Sanders announced his 2016 candidacy for president in May 2015, the Green Party total went down from 109,836 (0.62%) on February 10, 2015 to from 102,688 (0.59%) on January 5, 2016 to 77,868 (0.43%) on May 23, 2016 - likely largely as a result of Greens registering to vote for Sanders in the June 2016 California primary. The Green total rose back to 94,720 (0.49%) as of February 10, 2017 before falling again in 2020 to 79,577 (0.37%) as July 3, 2020 - again likely to Greens leaving the GPCA to vote in the March 2020 Democratic presidential primary.
Before this trend, the lowest raw total number of registered Greens was 78,597 in February 1995 (when it represented 0.59%). That original downward trend from 1992-1995 was a result of two primary factors - first, that many people registered Green during 1990-1991 in order to get the Green Party on the ballot, with the intent of un-registered Green afterwards (this was sometimes part of the necessary Green messaging during the 1990-1991 ballot status drive in order to qualify the party in the first place.) Second, there was Jerry Brown's (then progressive) presidential campaign in the June 1992 primary that drew many registered Greens to change their registration to vote for him, followed by competetive Democratic primaries for statewide office in 1994 that attracted many Greens, including then-State Senator Tom Hayden's progressive guberatorial campaign.
Next came the Ralph Nader 1996 presidential campaign, which kick-started a new wave of Green registration, followed by the Dan Hamburg Green gubernatorial campaign in 1998 and the second Nader Green presidentail campaign in 2000. This upward trend continued through Fall 2003, accentuated by the Peter Camejo for Governor Green campaign during the October 2003 recall election. With the benefit of the public seeing Camejo in televised gubernatorial debates, by September 2003 the statewide Green registration total was 166,740 (1.08%) and in January 2004, it was 162,354 (1.09%).
Afterwards started a long downward trend, which is the result of multiple factors (that are discussed in more depth in this companion proposal https://losangeles.cagreens.org/gpca/retaining-ballot-status-via-statewi....) Additionally the current 0.38% today and the 0.37% in July are the lowest Green registration percentages of total registered voters since the GPCA qualified for ballot status in January 1992.
At the rate that GPCA voter registration is declining, the GPCA could fall below the 0.33% by sometime in 2022 - and if the GPCA doesn't simulatneously get at least 2% of the vote in a 2022 statewide primary race, the GPCA will lose its ballot status at that point.
How to prevent that? It is cost effective to outreach to former Greens now and get some of them to come back to help the GPCA retain ballot status, rather than the GPCA offically losing ballot status and then having to fund an expensive voter registration campaign to regain it.
Proposal: That the GPCA as a state party, together with its county parties, undertake a campaign to attract former registered Greens to rejoin the GPCA, as well as to attact first time registered Greens, to be launched by early 2021. This campaign would include
1. An internal messaging development process at the state party and on county party levels, to develop a message on why past Greens should rejoin the Green Party, and why other voters should register Green for the first time.
2. Obtaining up-to-date Green voter registration lists statewide and on the county levels, and comparing them to past Green voter registration lists, in order to identify past registered Greens, and sending email outreach to them, where those email addreses exist
3. Including this messaging on GPCA and county party websites and social media.
Attachments/References
1. GPCA voter registration totals, 1986 to the present
https://www.sos.ca.gov/elections/voter-registration/voter-registration-s...
• 2020-02-18 81,304 0.38%
• 2020-07-03 79,577 0.37%
• 2020-02-18 83,281 0.40%
• 2019-10-01 90,762 0.45%
• 2019-02-10 88,771 0.44%
• 2018-10-22 89,517 0.45%
• 2018-09-07 88,134 0.46%
• 2018-05-21 90,404 0.48%
• 2018-04-06 90,459 0.48%
• 2018-01-02 91,631 0.48%
• 2017-02-10 94,720 0.49%
• 2016-10-24 94,647 0.49%
• 2016-09-09 84,759 0.46%
• 2016-07-07 78,604 0.43%
• 2016-05-23 77,868 0.43%
• 2016-01-05 102,688 0.59%
• 2015-02-10 109,836 0.62%
• 2014-10-20 110,511 0.62%
• 2014-09-05 109,674 0.62%
• 2014-05-19 108,954 0.62%
• 2014-05-19 109,157 0.62%
• 2013-12-31 108,785 0.62%
• 2013-02-10 112,973 0.63%
• 2012-10-22 115,034 0.63%
• 2012-09-07 109,488 0.63%
• 2012-05-21 110,724 0.65%
• 2012-04-06 110,431 0.65%
• 2012-01-03 111,319 0.66%
• 2011-02-10 113,118 0.66%
• 2010-10-18 113,835 0.66%
• 2010-09-03 111,772 0.66%
• 2010-05-24 112,655 0.66%
• 2010-04-09 112,136 0.66%
• 2010-01-05 111,395 0.66%
• 2009-05-04 113,922 0.66%
• 2009-03-20 114,637 0.67%
• 2009-02-10 116,048 0.66%
• 2008-10-20 118,416 0.68%
• 2008-09-05 116,334 0.72%
• 2008-05-19 120,725 0.75%
• 2008-04-04 121,867 0.77%
• 2008-01-01 131,185 0.84%
• 2007-12-07 132,501 0.86%
• 2007-09-04 136,018 0.88%
• 2007-02-10 138,861 0.89%
• 2006-10-23 141,451 0.89%
• 2006-09-08 140,085 0.90%
• 2006-05-22 143,573 0.92%
• 2006-05-22 143,573 0.92%
• 2005-10-24 146,865 0.92%
• 2005-09-09 147,565 0.93%
• 2005-02-10 157,565 0.95%
• 2004-10-18 160,579 0.97%
• 2004-09-07 156,914 1.00%
• 2004-02-17 157,749 1.05%
• 2004-01-02 162,354 1.09%
• 2003-09-30 166,740 1.08%
• 2003-09-22 165,722 1.03%
• 2003-08-08 160,129 1.03%
• 2003-02-10 156,803 1.03%
• 2002-10-21 155,952 1.02%
• 2002-10-07 151,031 0.98%
• 2002-09-06 147,243 0.98%
• 2002-02-19 146,251 0.96%
• 2002-02-02 144,396 0.94%
• 2002-01-04 144,031 0.94%
• 2001-10-02 144,033 0.94%
• 2001-02-10 141,637 0.91%
• 2000-10-10 138,734 0.88%
• 2000-09-08 121,595 0.80%
• 2000-02-07 108,904 0.74%
• 2000-01-07 104,401 0.71%
• 1999-10-05 103,227 0.70%
• 1999-02-10 98,350 0.66%
• 1998-10-03 98,443 0.66%
• 1998-05-04 93,380 0.64%
• 1998-04-03 91,404 0.63%
• 1997-12-30 89,769 0.62%
• 1997-09-12 89,111 0.61%
• 1997-02-10 94,054 0.61%
• 1996-10-07 95,090 0.61%
• 1996-09-09 89,102 0.59%
• 1996-02-26 83,523 0.58%
• 1996-01-26 79,935 0.56%
• 1995-10-24 79,825 0.56%
• 1995-09-12 81,103 0.59%
• 1995-02-10 78,597 0.59%
• 1994-10-11 86,198 0.59%
• 1994-06-07 86,782 0.61%
• 1994-05-08 86,792 0.61%
• 1994-04-08 86,543 0.61%
• 1994-01-04 90,032 0.62%
• 1993-10-04 91,342 0.63%
• 1993-09-03 90,878 0.63%
• 1993-02-10 93,497 0.65%
• 1992-10-05 98,724 0.67%
• 1992-09-04 95,116 0.69%
• 1992-05-04 93,026 0.76%
• 1992-04-03 100,518 0.80%
• 1992-02-03 103,903 ------%
• 1991-12-31 100,897 ------%
• 1991-09-01 37,167 -------%
• 1991-08-01 33,737 0.11%
• 1991-02-10 13,910 0.07%
• 1990-10-09 9,515 0.07%
• 1990-09-07 6,054 0.00%
• 1990-05-00 2,734 0.00%
• 1988-01-00 109 0.00%
• 1986-05-00 24 0.00%
Theme by Danetsoft and Danang Probo Sayekti inspired by Maksimer